


Learn how SNMP monitoring tracks network device health, performance, and security. See key metrics and how Nagios provides scalable visibility.
What Is SNMP?
Simple Network Management Protocol (SNMP) is a network protocol that enables administrators to monitor and manage network devices from a centralized system. SNMP provides a standardized framework for collecting performance metrics, configuration data, and status information from routers, switches, firewalls, servers, and other network infrastructure. This universal approach allows network teams to monitor equipment from multiple vendors using a single management platform, making SNMP essential for maintaining visibility across enterprise network monitoring environments.
Developed by the Internet Engineering Task Force (IETF) in 1988, SNMP was designed to solve the challenge of managing diverse networking equipment through a vendor-neutral protocol. The protocol has evolved through multiple versions—SNMPv1 (RFC 1157), SNMPv2c (RFC 1901-1908), and SNMPv3 (RFC 3411-3418)—with each iteration improving security and functionality. Network device manufacturers adopted SNMP support as a standard feature, ensuring that administrators could monitor Cisco, Juniper, HP, and other vendors’ equipment using the same tools and methods. Today, SNMP remains one of the most widely deployed monitoring protocols in enterprise environments.
In this article, we’ll explore how SNMP monitoring works, the essential components that make up the SNMP framework, and how network administrators use SNMP to maintain healthy, performant networks.
How SNMP Monitoring Works
SNMP monitoring relies on several core components working in coordination to monitor network device health and performance:
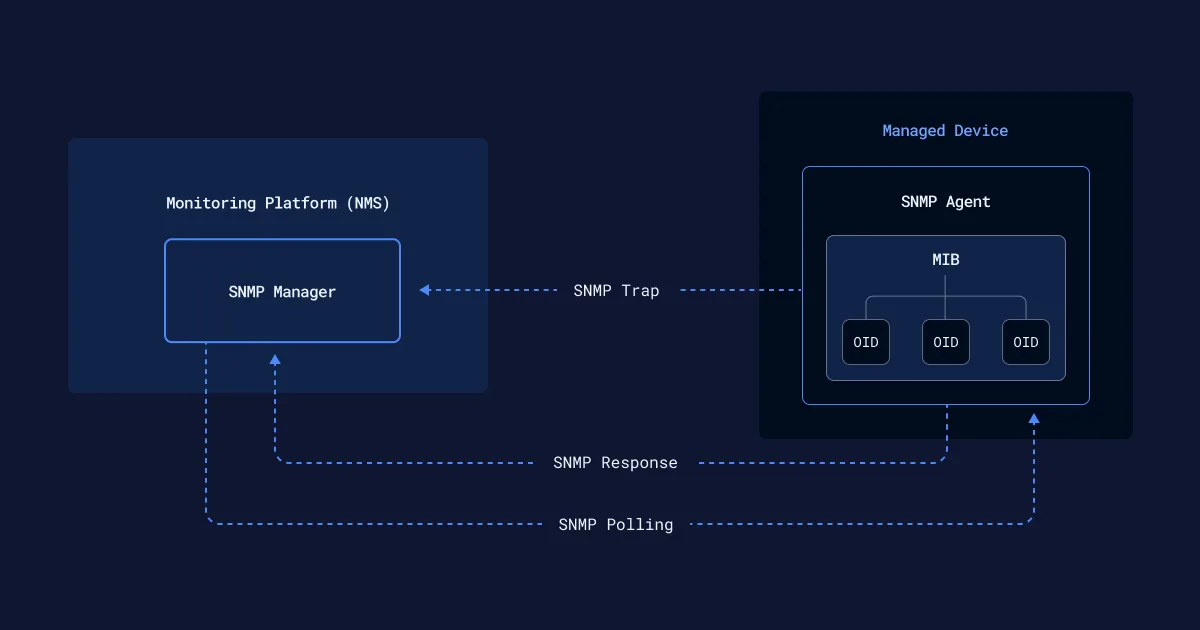
1. SNMP Manager
The SNMP manager is the central monitoring system that polls network devices for information. Management platforms like Nagios use SNMP to query devices at regular intervals, collect performance data, and analyze metrics against configured thresholds. When values exceed normal operating parameters, the manager triggers alerts to notify administrators of potential issues.
2. SNMP Agent
Every monitored device runs an SNMP agent—a lightweight software component that listens for requests from the manager. When polled, the agent retrieves the requested information from the device’s MIB and returns it to the monitoring system. Agents can also proactively send unsolicited notifications called SNMP traps when critical events occur, such as interface failures or authentication attempts.
3. Management Information Base (MIB)
The MIB acts as a device’s data dictionary, organizing all available monitoring information in a hierarchical structure. Each piece of information has its own unique address called an Object Identifier (OID), which SNMP managers use to request specific metrics. Industry-standard MIBs (defined by IETF RFCs) work across all vendors, while manufacturers also create custom enterprise MIBs to expose specialized features of their hardware.
4. Managed Device
A managed device is any network infrastructure component equipped with an SNMP agent and configured to respond to monitoring requests. This includes routers, switches, firewalls, servers, printers, and other IP-enabled equipment. For a device to participate in SNMP monitoring, it must have SNMP enabled, proper community strings or credentials configured, and network connectivity to the SNMP manager.
5. Object Identifier (OID)
An OID is a unique numeric address that identifies a specific data point within the MIB hierarchy. Structured as a dot-separated sequence (e.g.,1.3.6.1.2.1.1.3.0 for system uptime), each number represents a branch in the tree-like MIB structure. SNMP managers use OIDs to request precise metrics—whether standard values like CPU utilization or vendor-specific measurements like power supply voltage. Understanding OID structure is essential for crafting targeted monitoring queries and troubleshooting SNMP data collection issues.
SNMP Communication Methods
SNMP monitoring relies on several distinct commands that enable communication between managers and agents:
1. GET
The GET command retrieves the value of a specific object from a managed device. The SNMP manager sends a request containing the target OID, and the agent responds with the current value of that metric. GET is used for querying individual data points like interface status, system uptime, or temperature readings.
2. GETNEXT
GETNEXT retrieves the next object in the MIB hierarchy after a specified OID. This command enables managers to walk through the MIB tree sequentially without knowing every OID in advance. Network administrators use GETNEXT to discover available metrics on unfamiliar devices or to iterate through table entries like interface lists.
3. GetBulk
Available in SNMPv2c and SNMPv3, GetBulk efficiently retrieves multiple objects in a single request. Rather than sending dozens of individual GET or GETNEXT commands, GetBulk reduces network overhead by collecting large datasets at once. This command is particularly useful for retrieving interface statistics across devices with many ports.
4. SET
The SET command modifies configuration parameters on managed devices. Administrators use SET to remotely change settings like interface descriptions, SNMP community strings, or administrative contact information. Due to security implications, SET operations typically require write-access credentials and should be carefully controlled in production environments.
5. SNMP Traps
Unlike polling commands initiated by the manager, traps are unsolicited notifications sent by agents when specific events occur. Devices generate traps for critical conditions like interface failures, authentication attempts, power supply issues, or temperature thresholds. SNMP trap management enables real-time alerting without waiting for the next scheduled polling cycle, ensuring administrators receive immediate notification of urgent situations.
SNMP Versions: v1, v2c, and v3
Simple Network Management Protocol has evolved significantly since its introduction in 1988. Different versions of SNMP have been developed to improve security, enhance functionality, and optimize performance. Here’s an overview of SNMP versions 1, 2, and 3.
SNMPv1
The original SNMP specification defined in RFC 1157 (1988). SNMPv1 provides basic monitoring functionality but uses community strings (plain-text passwords) for authentication, making it vulnerable to interception and unauthorized access. While still found in legacy environments, SNMPv1 is largely obsolete for modern deployments.
Key Characteristics
Simple implementation and broad device support
Community string authentication (transmitted in clear text)
32-bit counters for metrics
Limited error handling capabilities
No encryption of transmitted data
SNMPv2c
Introduced in the early 1990s and standardized in RFC 1901-1908, SNMPv2c (community-based) added significant performance improvements including 64-bit counters for high-speed interfaces, bulk data retrieval through the GetBulk operation, and enhanced error reporting with more specific error codes. However, it retained the same community string authentication model as v1, leaving security concerns unaddressed.
Key Improvements:
GetBulk operation for efficient bulk data retrieval
64-bit counters supporting bandwidth monitoring on high-speed interfaces
Improved error codes and exception handling (noSuchObject, noSuchInstance, endOfMibView)
Better manager-to-manager communication with InformRequest
Still uses plain-text community strings
SNMPv3
The current recommended version, defined in RFC 3410-3415 (2002), SNMPv3 adds comprehensive security features through the User-based Security Model (USM). SNMPv3 provides three security levels—noAuthNoPriv (no security), authNoPriv (authentication only), and authPriv (authentication and encryption)—allowing administrators to balance security requirements with performance considerations.
Security Enhancements
Authentication protocols: HMAC-MD5-96 and HMAC-SHA-96 (with SHA-224, SHA-256, SHA-384, SHA-512 support in modern implementations)
Encryption algorithms: DES (required by RFC 3414), 3DES, AES-128 (RFC 3826), AES-192, and AES-256
Message integrity verification to detect tampering and replay attacks
View-Based Access Control Model (VACM) for granular permissions management
User-based authentication replacing community strings with individual user credentials
Best Practice: Always use SNMPv3 with the authPriv security level when monitoring devices over untrusted networks or in regulated industries. The authPriv mode provides both authentication and encryption, ensuring secure network management communications.
Essential SNMP Metrics for Device Health
SNMP monitoring tracks a comprehensive range of metrics that provide insight into device health and network performance. These metrics are organized in standard Management Information Bases (MIBs) defined by the IETF, ensuring consistent monitoring across vendor platforms.
System Status Metrics (MIB-II)
System Uptime: Time elapsed since the device last restarted (sysUpTime from RFC 1213)
Device Description: Hardware model, operating system version, and firmware details
System Contact & Location: Administrative information for device ownership and physical placement
Interface Administrative Status: Whether interfaces are administratively enabled or disabled
Interface Operational Status: Real-time state of network ports (up, down, testing, dormant)
Performance Metrics
CPU Utilization (HOST-RESOURCES-MIB):
Processor load percentages across multiple time intervals (5-second, 1-minute, 5-minute averages)
Per-core CPU statistics on multi-processor systems
Critical for identifying processing bottlenecks before they impact forwarding performance
Memory Utilization (HOST-RESOURCES-MIB):
Total RAM, used memory, and available memory
Buffer and cache utilization
Memory allocation by process for troubleshooting resource exhaustion
Interface Traffic Statistics (IF-MIB, RFC 2863):
Bandwidth Utilization: Inbound and outbound data rates measured in bits per second or bytes per second
Packet Counters: Unicast, multicast, and broadcast packets transmitted and received
Error Metrics:
- ifInErrors / ifOutErrors: Packets with detected errors (CRC failures, frame errors)
- ifInDiscards / ifOutDiscards: Valid packets dropped due to buffer overflow or policy
Collision Counters: Half-duplex Ethernet collision detection
64-bit High-Capacity Counters: Essential for monitoring high-speed interfaces (10 Gigabit and above) to prevent counter rollover
Availability Metrics
Response Time: Device reachability and ICMP latency measurements
Packet Loss: Percentage of failed polling attempts indicating connectivity issues
Interface Link Status: Physical layer status for switch monitoring and port health tracking
Service Availability: Application-specific health checks (HTTP, DNS, DHCP services)
Environmental Metrics (Vendor Enterprise MIBs)
Temperature Sensors: Device chassis and component temperature readings with threshold alerting
Power Supply Status: Redundant power supply operational state and voltage levels
Fan Speed: Cooling system RPM measurements and failure detection
Voltage Rails: Electrical system measurements for power distribution health
Nagios SNMP monitoring automatically collects these metrics across your infrastructure, correlating data from standard and vendor-specific MIBs, presenting unified dashboards, and triggering intelligent alerts when thresholds are breached.
Benefits of SNMP Monitoring
Implementing SNMP monitoring delivers measurable operational benefits for IT teams managing modern network infrastructure:
Proactive Issue Detection: Continuous monitoring of device health enables early warning of potential failures before they cause service disruptions. By detecting performance degradation, capacity constraints, or hardware anomalies during normal operation, teams can schedule corrective maintenance during planned windows rather than responding to emergency outages. Research shows organizations with proactive monitoring reduce mean time to detect (MTTD) issues by 60-80% compared to reactive approaches.
Vendor-Agnostic Device Support: SNMP’s standardized approach works seamlessly across diverse hardware platforms—Cisco routers, Juniper switches, HP servers, Fortinet firewalls, Aruba wireless controllers, and thousands of other device types. This protocol-level standardization eliminates the need for multiple vendor-specific monitoring solutions in heterogeneous environments, reducing both licensing costs and operational complexity.
Agentless Architecture: Unlike agent-based monitoring requiring software installation and maintenance on every endpoint, SNMP monitoring leverages protocol support built directly into network operating systems. This agentless approach reduces deployment time, minimizes security attack surface, and simplifies management of network infrastructure where agent installation may be impractical or impossible (embedded systems, IoT devices, legacy equipment).
Performance Optimization and Capacity Planning: Historical performance data collected through SNMP monitoring reveals trends and patterns critical for infrastructure optimization. Network teams analyze traffic patterns to identify congestion points, right-size bandwidth allocations, and forecast when capacity upgrades will be needed. This data-driven approach prevents over-provisioning (wasting budget) and under-provisioning (causing performance degradation).
Security and Compliance: SNMP monitoring helps detect unauthorized configuration changes, failed authentication attempts, and anomalous device behavior indicative of security incidents. Detailed audit logs and automated reporting support compliance requirements in regulated industries (HIPAA, PCI-DSS, SOX) by documenting network activity, administrative actions, and policy enforcement. SNMPv3’s authentication and encryption capabilities ensure monitoring traffic itself doesn’t introduce security vulnerabilities.
Reduced Downtime and Faster Resolution: Faster mean time to detection (MTTD) combined with comprehensive diagnostic data reduces mean time to resolution (MTTR), directly improving service availability. When monitoring systems identify issues immediately and provide administrators with relevant metrics (which interface failed, what error counters increased, when the problem began), troubleshooting becomes targeted rather than exploratory. Organizations report 40-70% reductions in average incident resolution time after implementing comprehensive SNMP monitoring.
Cost Efficiency: By preventing outages, optimizing resource utilization, and enabling data-driven infrastructure decisions, SNMP monitoring delivers measurable ROI. The cost of monitoring tools and staff time is minimal compared to revenue loss from network downtime. Unplanned downtime now averages $14,056 per minute across organizations, rising to $23,750 per minute for large enterprises, according to 2024 research from Enterprise Management Associates.
SNMP Monitoring Tools and Platforms
Effective SNMP monitoring requires robust management software that can scale across enterprise infrastructure while providing actionable insights. Key capabilities to look for include:
Automated Device Discovery: Modern SNMP monitoring solutions automatically discover network devices using protocol scanning and topology mapping. This eliminates manual configuration and ensures new devices are monitored immediately when added to the network.
Flexible Alert Configuration: Threshold-based alerting with customizable escalation policies ensures the right teams are notified when issues occur. Nagios SNMP monitoring supports complex alert logic, notification methods (email, SMS, integrations), and schedule-based alert suppression.
Centralized Dashboards: Unified visibility across all monitored devices through customizable dashboards, topology maps, and performance graphs. Administrators can drill down from high-level overviews to detailed device metrics without switching between tools.
Scalability for Enterprise Networks: The ability to monitor thousands of devices efficiently without performance degradation. Distributed monitoring architectures with central management enable large-scale deployments across multiple data centers and geographic locations.
Historical Data and Reporting: Long-term metric storage with trending analysis and customizable reports. Performance data retention supports capacity planning, SLA verification, and compliance documentation.
Implementing SNMP Monitoring with Nagios
Nagios provides comprehensive SNMP monitoring capabilities designed for enterprise network environments. The platform combines agentless monitoring, flexible configuration, and powerful alerting to deliver complete infrastructure visibility.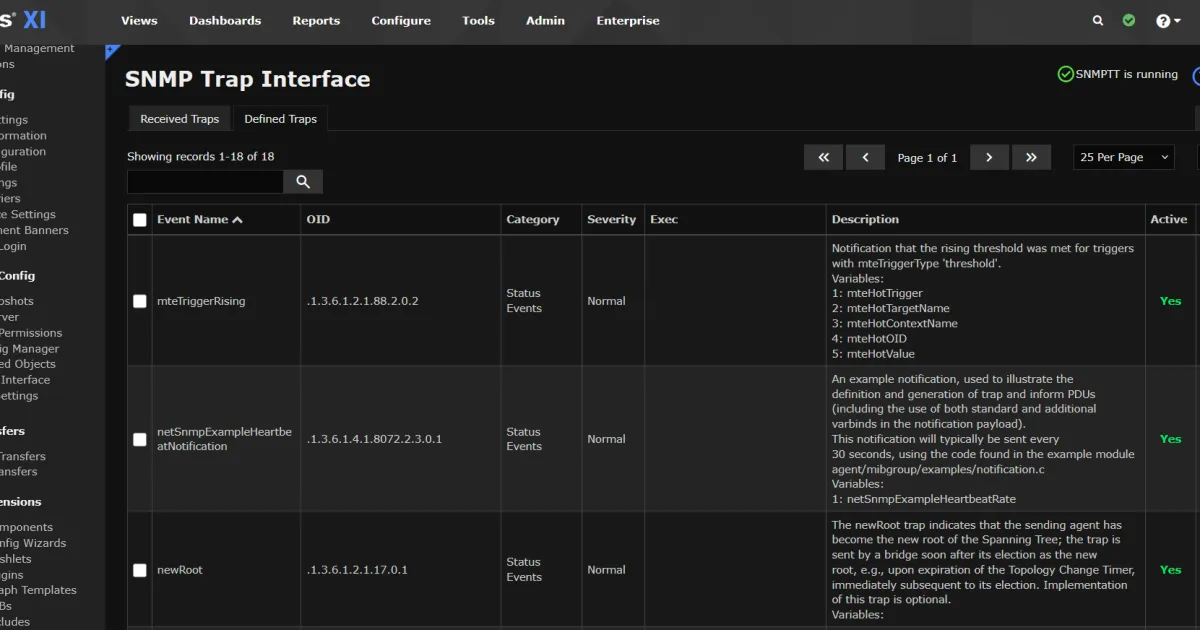
Key Nagios SNMP Features
Comprehensive Device Support: Monitor network equipment from all major vendors including Cisco, Juniper, HP, Dell, Arista, Palo Alto Networks, and hundreds more through standard and enterprise MIB support.
Intelligent Alerting: Configure threshold-based alerts with customizable notification rules. Receive alerts via email, SMS, Slack, PagerDuty, and other channels when SNMP metrics exceed normal parameters.
SNMP Trap Processing: Real-time monitoring of SNMP trap notifications enables immediate response to critical events without waiting for polling cycles.
Custom Check Development: Create tailored SNMP checks for specific metrics or business requirements using Nagios plugin architecture. Pre-built check commands accelerate deployment for common monitoring scenarios.
Multi-Site Monitoring: Distributed monitoring architecture supports geographically dispersed infrastructure with central management and reporting. Monitor remote offices, cloud environments, and hybrid networks from a single interface.
SNMP Monitoring Best Practices
To maximize the value of SNMP monitoring, consider these proven practices:
Use SNMPv3 for Security-Sensitive Environments: Always implement SNMPv3 with strong authentication and encryption when monitoring production networks, particularly for financial services, healthcare, or other regulated industries where data security is critical.
Optimize Polling Intervals: Balance monitoring frequency against device load and network bandwidth. Critical infrastructure may warrant 1-minute polling intervals, while less critical devices can use 5-10 minute intervals. Adjust based on device capabilities and monitoring requirements.
Implement Baseline Thresholds: Establish normal operating ranges for each metric before configuring alerts. Use historical data to define realistic thresholds that minimize false positives while catching genuine issues.
Monitor Environmental Conditions: Don’t overlook temperature, power, and fan status metrics. Environmental failures often precede hardware issues, providing early warning of potential problems.
Document MIB Requirements: Maintain an inventory of required MIBs for your device fleet. Custom or enterprise MIBs may need to be imported into your monitoring system to access vendor-specific metrics.
Leverage SNMP Traps: Combine polling with trap monitoring for comprehensive coverage. While polling provides regular status updates, traps deliver immediate notification of critical events.
Plan for Scale: Design your SNMP monitoring architecture with growth in mind. Distributed monitoring, hierarchical configurations, and efficient polling strategies enable scaling from hundreds to thousands of devices.
Integrate with Other Monitoring: SNMP monitoring works best as part of a comprehensive monitoring strategy. Combine with Linux monitoring, application performance monitoring, and log analysis for complete infrastructure visibility.
Frequently Asked Questions
What is SNMP monitoring used for?
SNMP monitoring collects real-time performance data from network devices including routers, switches, servers, and firewalls. It tracks metrics like CPU usage, memory consumption, interface traffic, and device availability to help IT teams maintain network health and prevent outages.
What's the difference between SNMP polling and SNMP traps?
SNMP polling involves the monitoring system actively querying devices at scheduled intervals to collect metrics. SNMP traps are unsolicited notifications that devices send immediately when specific events occur, enabling real-time alerting without waiting for the next polling cycle.
Which SNMP version should I use?
SNMPv3 is recommended for most deployments because it provides strong authentication, message encryption, and access control. Use SNMPv2c only in trusted network segments where security is less critical. Avoid SNMPv1 except when required for legacy device compatibility.
Does SNMP monitoring require installing agents on devices?
No, SNMP monitoring is agentless. Most network devices include built-in SNMP agent functionality that can be enabled through device configuration. The monitoring system communicates with these native agents without requiring additional software installation.
What network devices support SNMP monitoring?
Nearly all professional network equipment supports SNMP including routers, switches, firewalls, load balancers, wireless controllers, servers, storage systems, UPS devices, environmental sensors, and printers. Support is built into most operating systems and network device firmware.
How do I configure SNMP monitoring in Nagios?
Nagios SNMP configuration involves enabling SNMP on your devices, defining hosts in Nagios, associating SNMP check commands with desired metrics, and setting alert thresholds. Nagios includes configuration wizards and templates to streamline setup for common device types.
Can SNMP monitoring work across different vendors?
Yes, SNMP is a vendor-agnostic standard protocol. While specific OIDs and enterprise MIBs may vary between manufacturers, standard MIB-II objects work across all SNMP-compliant devices, enabling unified monitoring of heterogeneous infrastructure.
What's the difference between SNMP monitoring and other monitoring protocols?
SNMP is specifically designed for network infrastructure monitoring with widespread device support. Other protocols like WMI (Windows), SSH (Linux), or IPMI (hardware) serve different purposes. Comprehensive monitoring often combines multiple protocols based on what’s being monitored.
Take Control of Your Network Infrastructure
SNMP monitoring provides the foundation for effective network management, delivering the real-time visibility and proactive alerting that IT teams need to maintain uptime and optimize performance. By understanding SNMP fundamentals and implementing robust monitoring tools, organizations can prevent issues before they impact users, optimize resource utilization, and meet compliance requirements.
Nagios delivers enterprise-grade SNMP monitoring with the flexibility, scalability, and reliability that modern IT environments demand. From automated device discovery to customizable alerting and comprehensive reporting, Nagios helps teams implement effective monitoring strategies across diverse infrastructure.
Ready to improve your network monitoring?
Explore Nagios pricing plans or contact us to discuss how Nagios can meet your specific SNMP monitoring requirements.